Analytics & reporting
See at a glancewhere it works
Whether it's a daily analysis, benchmarking, location comparison or evaluation of results. You have all key figures transparent, available in Nesto at any time. This allows you to control precise control across all locations.
Trust from leading brands


What you can do with Analytics
The most important benefits on a glimpse
Hourly deviations immediately visible
Compare forecast with actual sales per hour. Deviations are presented visually and you can immediately see where planning did not match reality.
Compare locations, identify best practices
Which location has a better personnel cost ratio, higher productivity or more precise planning? Learn from your best locations.
Data instead of gut feeling
All key figures can be retrieved at any time, presented visually, across all locations.
Weekly KPIs including wage costs transparent
All important key figures per calendar week in one place. Clear and comparable.

My conclusion:
Modern & innovative with potential for the future! I was very impressed by Nesto: AI forecast with 92% accuracy rate, automatic planning with top computing power & time savings of 70-80%, interfaces for payroll and a great employee app that is well received.”

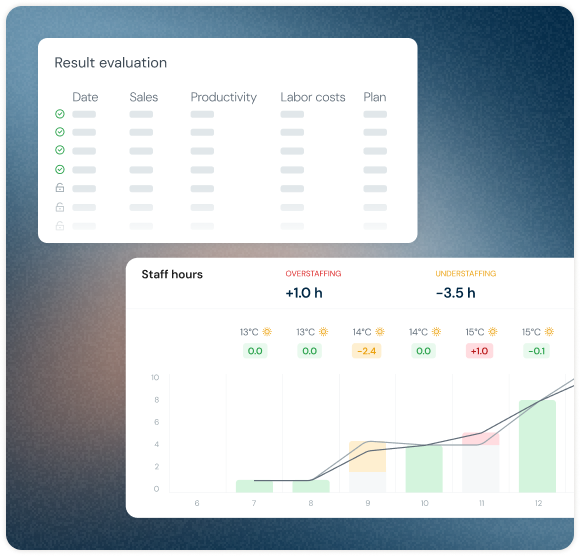
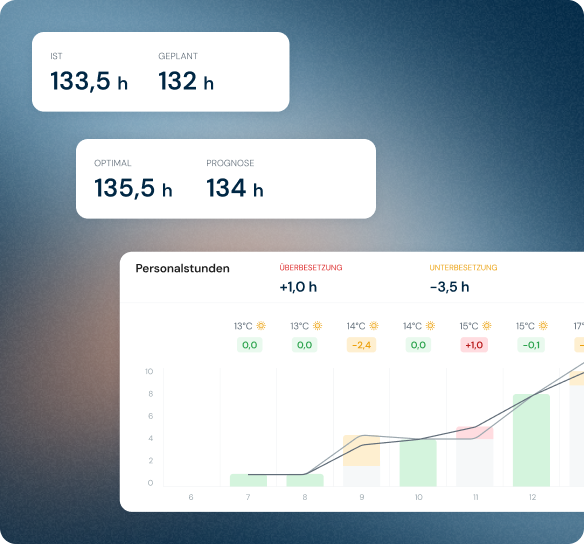
Real time overview
Hourly forecasts vs. reality
Our analyses show hourly sales, cumulative turnover and employee requirements. You can immediately see whether planning was carried out in line with your needs.
View: revenue per hour, cumulative revenue, employee demand
4 KPIs: Planned Staffing, Optimal Staffing, Predicted Demand, Actual Staffing
Hourly comparisons show discrepancies instantly
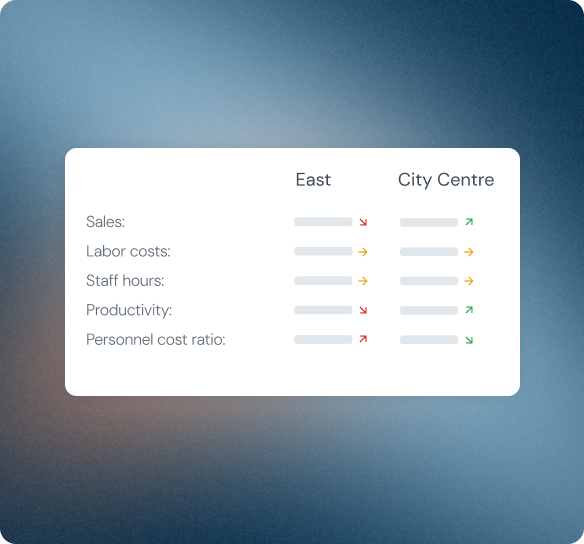
Location comparison
Create transparency and comparability
Compare key figures over time or between locations Our benchmarking provides a quick overview: Where is it doing better? Where is there potential for optimization?
Location comparisons: Which location performs best?
Comparisons over time: kW-to-kW development visible
All key figures at a glance: turnover, wage costs, productivity
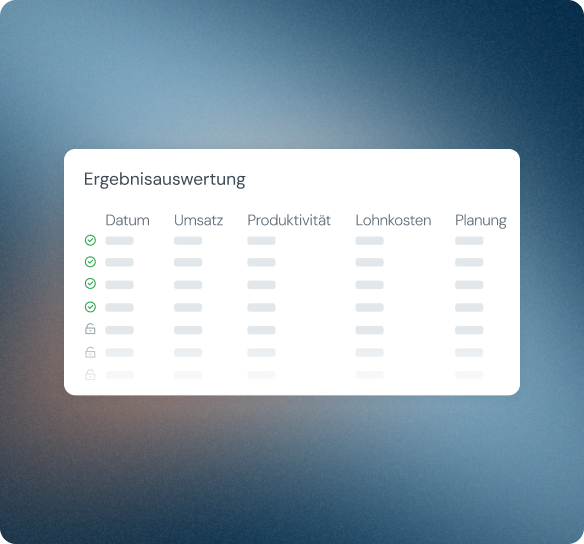
Weekly KPIs
Overview of all important key figures
With our overview, you can see the most important key figures per calendar week: wage costs including additional costs, personnel cost ratio, turnover. In addition, you will recognize all completed days. Perfect for weekly management reviews.
Calendar week overview: All KPIs at a glance
Wage costs including additional costs presented transparently
End of day status


Ready for precise control of all locations?
In a demo, we'll show you how Nesto provides precise personnel cost management,
standardized KPIs and automated compliance with labor law for your locations.
Watch the platform live and let's raise the potential of your businesses together.

For us, Nesto is more than just a tool. It is a strategic partner who has been helping us to optimize our operations, simplify processes and successfully grow sustainably for years.
.png)

My conclusion:
Modern & innovative with potential for the future! I was very impressed by Nesto: AI forecast with 92% accuracy rate, automatic planning with top computing power & time savings of 70-80%, interfaces for payroll and a great employee app that is well received.”

Nesto has provided us with simple and reliable time recording and tailored individual solutions precisely to our requirements. Through transparent evaluations and intuitive handling, Nesto makes our everyday work much easier.
Nesto scales with and makes equal sense for everyone — whether for our smaller companies with a few employees or one of our larger chains

We are an up-and-coming concept and have been working with Nesto right from the start. Together with Nesto, we will be able to safely drive forward our expansion.

“With Nesto, we can keep track of hundreds of shifts, locations and employees — simply and efficiently”
More features
See what else you can do with Nesto
Nesto AI is just the start. Nesto offers you an end-to-end platform for precise personnel planning, ranging from AI-based forecasts to error-free preparatory payroll.
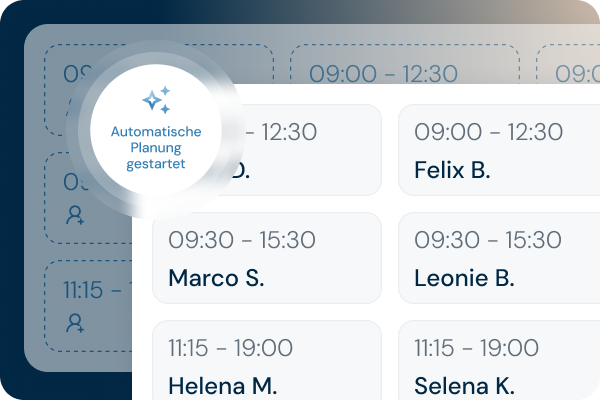
Automatic AI WFM
Optimal work schedules in seconds instead of hours. Based on forecasts, qualifications, and compliance. Everything is automatic and legally secure.
Operations Dashboard
See directly what is happening on the surface. All your key figures, employees and shifts at a glance.
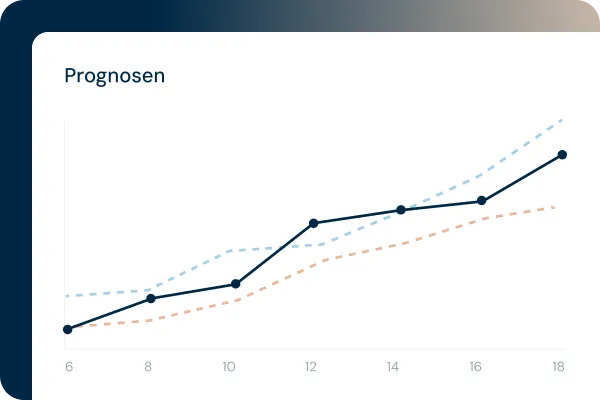
Revenue forecasts
Accurate demand forecasts with 90% + accuracy. The AI analyses sales, weather and events for demand-oriented planning instead of gut feeling.
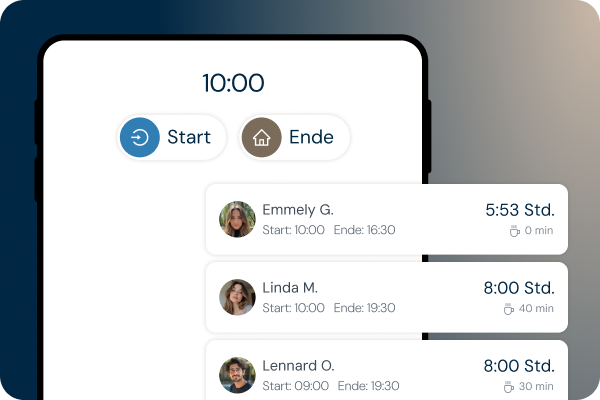
Time recording
Time recording down to the second with automatic compliance check. Error-free data directly for your payslip.
FAQ
Everything you need to know about the shift manager dashboard From functions to integration to use.

Any more questions about the dashboard?
Our team is happy to answer all your questions or show you the dashboard live in a demo
What is the daily analysis and what is it used for?
Die Tagesanalyse is the Herzstück the Tagescontrollings in Nesto. Sie bietet drei Ansichten: (1) Umsatz pro Stunde (Prognose vs. Ist-Umsatz stündlich), (2) Umsatz kumuliert (Tagesbasis-Vergleich), (3) Mitarbeiterbedarf (geplante vs. optimale vs. tatsächliche Besetzung). Du siehst stündlich, ob bedarfsorientiert geplant wurde, ob Prognosen präzise waren and ob the Dienstplan in the Praxis umgesetzt wurde. Kritisch for operative Exzellenz im Tagescontrolling.
Which KPIs does the daily analysis show for restaurants and hotels?
Die Tagesanalyse zeigt 4 zentrale KPIs for Personalcontrolling in Gastronomie and Hotels: (1) Geplante Personalbesetzung (im Dienstplan geplante Stunden), (2) Optimale Besetzung (benötigte Stunden basierend on tatsächlichem Umsatz), (3) Prognostizierter Mitarbeiterbedarf (benötigte Stunden basierend on Prognose), (4) Tatsächliche Personalbesetzung (gestempelte Stunden). Vergleiche zwischen diesen KPIs zeigen, ob bedarfsorientiert geplant wurde – essentiell for datenbasiertes Reporting in the Hospitality-Branche.
How does benchmarking work for restaurant chains and hotel groups?
Benchmarking ermöglicht Vergleich wichtiger Kennzahlen zwischen Restaurant-Standorten, Hotel-Properties or Einzelhandels-Filialen. Zwei Tabellen zeigen: (1) Standort-Vergleiche (welches Restaurant has bessere Labor cost ratio, welches Hotel höhere Produktivität?), (2) Zeitliche Vergleiche (e.g. KW 1 vs. KW 10). Perfekt for Gastronomie-Ketten, Hotel-Gruppen and Einzelhandels-Betriebe um Best Practices to identifizieren and on andere Standorte to übertragen.
What zeigt the Ergebnisauswertung for hospitality und Einzelhandel??
Die Ergebnisauswertung is eine tabellarische Übersicht the wichtigsten Kennzahlen pro Kalenderwoche for Restaurants, Einzelhandel, Bäckereien and Hotels: Umsatz, Lohnkosten including Nebenkosten, Labor cost ratio, Arbeitsstunden, Produktivität. Ein Schloss-Icon zeigt, ob alle Tage abgeschlossen sind. Perfekt for wöchentliche Management-Reviews in the Hospitality-Branche and im Einzelhandel.
Can I analyze multiple restaurant locations or hotel properties simultaneously?
Ja. Das Benchmarking-Feature ermöglicht Analyse and Vergleich aller Standorte gleichzeitig – ob 50 Restaurants, 20 Hotels or 100 Bäckerei-Filialen. Du kannst alle Standorte after beliebigen Kennzahlen sortieren and filtern. Sieh sofort, welches Restaurant the beste Performance hat, welches Hotel Optimierungsbedarf hat. Perfekt for Gastronomie-Ketten, Hotel-Gruppen and Einzelhandels-Betriebe with zentralem Controlling.